Employees and workers
(GRI 2-7)
|
|
|
|
|
|
|
|
|
|
Group |
Switzerland |
Foreign |
|||
|
Employees 1 |
2023 |
2022 |
2023 |
2022 |
2023 |
2022 |
|
|
|
|
|
|
|
|
|
Women |
|
|
|
|
|
|
|
Part-time |
116 |
72 |
84 |
56 |
32 |
16 |
|
Full-time |
256 |
229 |
108 |
98 |
148 |
131 |
|
|
|
|
|
|
|
|
|
Men |
|
|
|
|
|
|
|
Part-time |
49 |
39 |
47 |
37 |
2 |
2 |
|
Full-time |
861 |
846 |
482 |
458 |
379 |
389 |
|
|
|
|
|
|
|
|
|
Total |
1,282 |
1,186 |
721 |
649 |
561 |
538 |
1 Full time > = 90%, Part-time < 90%
Table 3: Overview of Alpiq Group employee numbers.
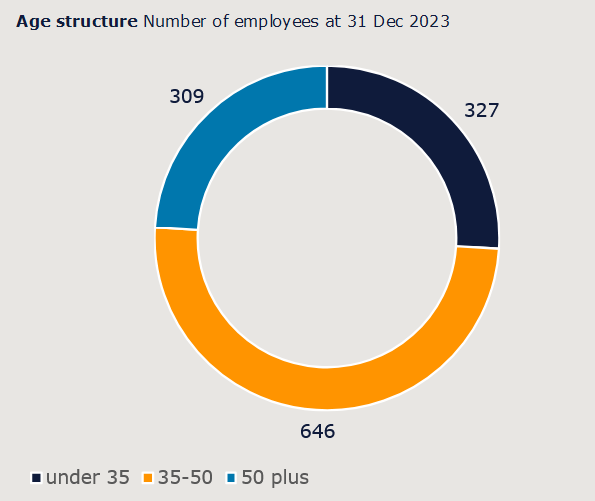
The data refers to employees (head count), including apprentices, of the entire Alpiq Group. It does not include those without an Alpiq employment contract. According to the Alpiq Holding Ltd. Annual Report 2023, this corresponds to 1,221 full-time equivalents. It does not include those without an Alpiq employment contract. On 31 December 2023, Alpiq employed people from 56 different nations (prior year: 48 nations). The age structure is balanced: 50% of employees are aged between 35 and 50, 26% are younger than 35 and 24% are 50 plus. In the previous year, 55% were between 35 and 50 years old, 24% under 35 and 22% over 50 years.
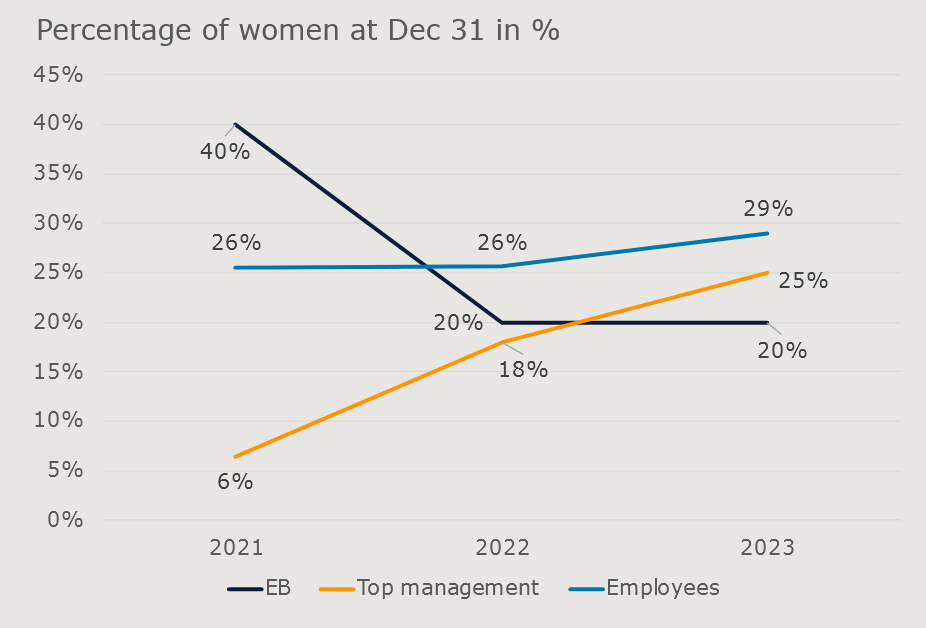
At the end of 2023, women were represented proportionately as follows: 20% of the Executive Board (2022: 20%), 25% of top management (2022: 18%; the top management corresponds to one level below the Executive Board) and 29% of the employees (2022: 25%) were women. In 2030, Alpiqʼs goal is to employ around 35% women in senior management positions. See “GRI 405: Diversity and equal opportunity”.
GRI 2-8: Workers who are not employees
At Alpiq, in addition to bridging short-term staff shortages with external temporary staff, we also have employees working on consultancy mandates. External knowledge is also used for projects where we do not have the necessary expertise internally.